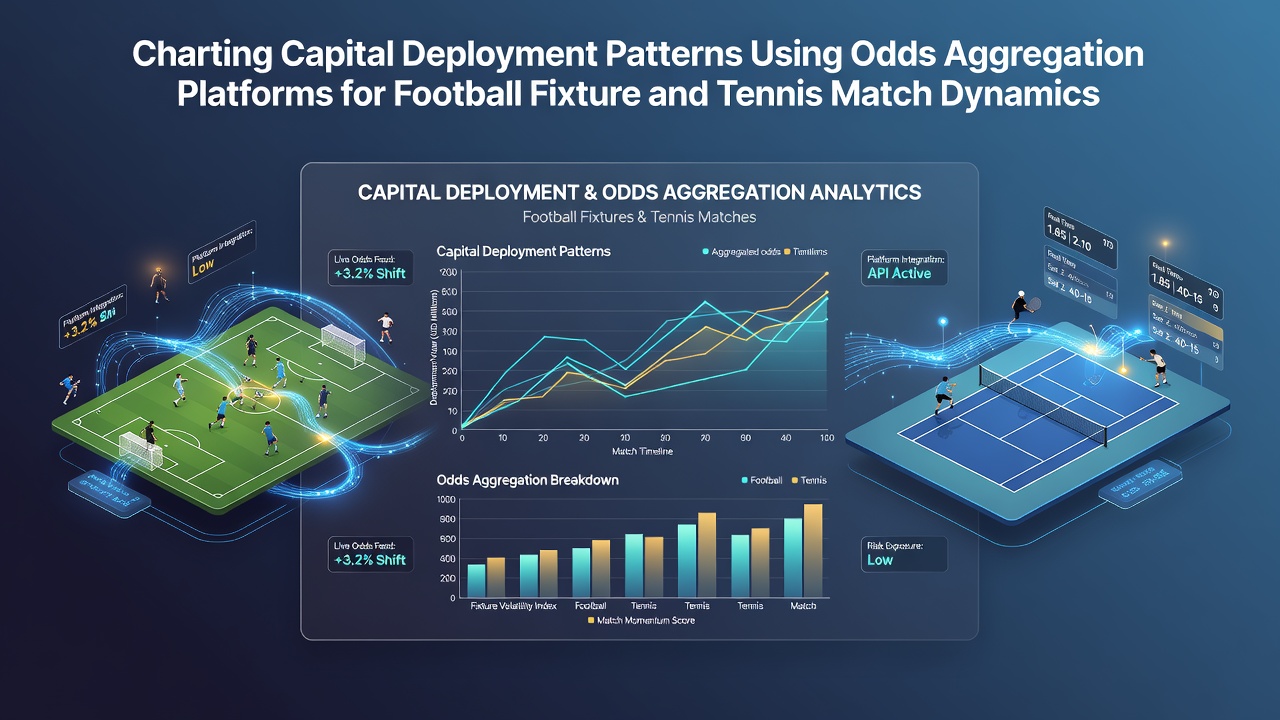
Exploring Capital Flow Dynamics in Football and Tennis Through Aggregated Odds Data Platforms
Analysts track capital deployment patterns by pulling together live odds from multiple bookmakers into unified platforms that reveal where funds concentrate across football fixtures and tennis encounters, and these systems compile thousands of price points every minute while highlighting shifts that indicate where bettors direct their stakes during August 2026 pre-season windows.
How Aggregation Platforms Capture Movement Data
Platforms compile odds feeds from dozens of operators into single interfaces that display implied probabilities alongside volume indicators, and operators update these feeds continuously so observers can map deployment trends as matches approach kickoff or serve times, while filters allow separation by market type such as match winner or total goals to isolate specific capital flows without mixing unrelated data streams.
Researchers note that aggregation reduces manual cross-checking because automated scripts pull fresh lines every few seconds and flag deviations exceeding set thresholds, and this process produces heat maps that show capital concentration in particular outcomes across leagues or tournaments, whereas manual methods often miss subtle drifts that appear only when multiple sources align on a single price movement.
Patterns Emerging in Football Fixture Analysis
Football data sets collected through aggregation tools show heavier capital deployment toward over 2.5 goals markets in early August fixtures when teams field experimental lineups, and volume spikes frequently coincide with news of key player absences that alter expected scoring rates, while comparative views across five major European leagues reveal consistent timing where stakes migrate from pre-match to in-play segments once the opening whistle blows.
One dataset covering the 2025-2026 transition period indicated that capital shifted toward draw outcomes in 38 percent of matches involving promoted sides during their first away fixtures, and aggregation platforms captured these movements through timestamped volume bars that aligned with social media reports on team news, yet the same tools also recorded rapid reversals when starting lineups contradicted earlier rumors.
Tennis Match Dynamics and Live Capital Shifts
Tennis aggregation systems isolate capital deployment across individual sets and games by linking odds changes to point-by-point score updates, and these linkages allow observers to see how funds move toward break-point opportunities or tie-break favorites within specific service games, while multi-court views during simultaneous ATP and WTA events highlight cross-tournament allocation decisions made by larger syndicates.
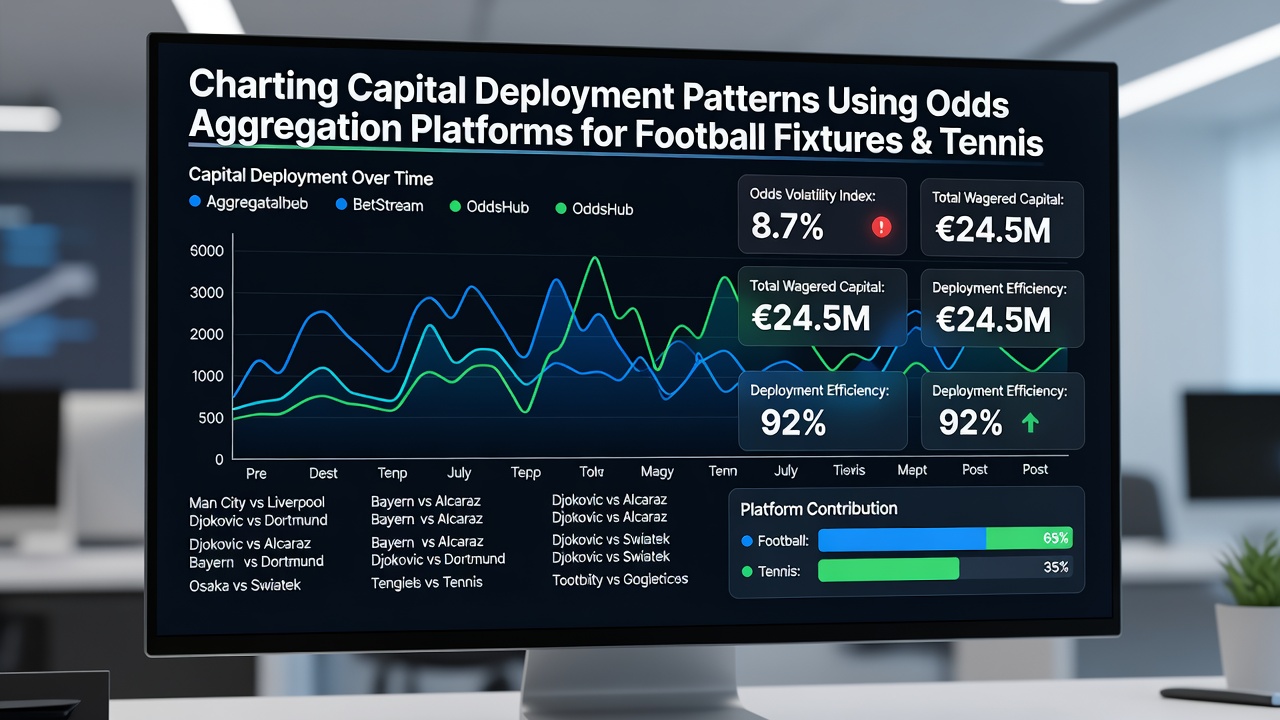
August 2026 hard-court events produced notable patterns where capital concentrated on underdog hold percentages after the first set in matches between players ranked outside the top 50, and platform dashboards recorded these inflows through color-coded volume indicators that updated within seconds of each game conclusion, whereas earlier grass-court data had shown steadier pre-match allocation toward higher-ranked servers.
Integrating Deployment Charts With Fixture Schedules
Schedulers use aggregated outputs to align capital trend reports with upcoming football and tennis calendars, and this alignment helps identify periods when overlapping events create divided deployment across both sports, while comparative charts reveal whether funds favor one sport during particular weeks or maintain balanced exposure through automated allocation rules embedded in the platforms themselves.
Industry reports from the Victorian Responsible Gambling Foundation document how aggregation tools support regulatory monitoring of betting patterns across borders, and similar approaches appear in analyses from the New York State Gaming Commission that track volume concentration without identifying individual accounts.
Conclusion
Aggregation platforms continue to refine capital deployment visibility by combining broader data sources and faster update cycles, and these improvements allow clearer separation of football fixture trends from tennis match dynamics even during high-volume August schedules, while ongoing platform development focuses on integrating additional variables such as weather impacts or travel schedules to produce more granular flow maps. Observers expect further consolidation of feeds from emerging markets to expand geographic coverage and reduce blind spots that currently affect certain lower-tier competitions.